Atom-JEPA is a large-scale self-supervised pretraining method for 3D atomistic systems. It learns by predicting the latent representations of one part of an atomic structure from another and works for both molecules and crystals. Atom-JEPA has been fine-tuned for diverse downstream property prediction tasks, including molecular ADMET, quantum-chemical properties, and physical properties of crystalline materials. Pretrained checkpoints are available on Hugging Face, with source code on GitHub and a PyPI package to make fine-tuning for new downstream tasks easier.
Benchmark results
Quantum-chemical properties and molecular ADMET, evaluated against established models.
FIGURE 01
QM9 and ADMET benchmarks
ADMET (Biogen, ExpansionRX, and ChEMBL-MT) · average model rank
View all average ranks
| Model | Readout | Rank [Equal dataset weight] | Rank [Equal target weight] |
|---|---|---|---|
| Atom-JEPA ×10 conformers | Fine-tuned | 2.4196 | 3.2895 |
| Atom-JEPA | Fine-tuned | 3.7204 | 4.7895 |
| CKERMT | Fine-tuned | 4.3885 | 4.5263 |
| KERMT | Fine-tuned | 5.5296 | 5.5263 |
| Chemprop | Other | 8.0100 | 8.5526 |
| Mol-JEPA · modalities | Other | 8.6552 | 8.7632 |
| Morgan + RDKit | LightGBM | 8.8819 | 7.8421 |
| Morgan + RDKit + Avalon + ErG | MLP | 9.8670 | 12.8947 |
| Atom-JEPA · last layer | MLP | 9.9456 | 10.1842 |
| RDKit | LightGBM | 10.5448 | 8.8158 |
| Mol-JEPA · CLS | Other | 10.5478 | 10.2368 |
| Morgan + RDKit + Avalon + ErG | LightGBM | 10.6433 | 9.3421 |
| Atom-JEPA · all layers | MLP | 11.2459 | 11.7105 |
| Morgan + RDKit | MLP | 12.2096 | 14.6842 |
| RDKit | MLP | 12.7111 | 11.5789 |
| Morgan | LightGBM | 13.1174 | 12.1842 |
| Mol-JEPA · CLS | LightGBM | 13.6556 | 12.0789 |
| Morgan | MLP | 14.9067 | 14.0000 |
18 models across 38 targets: Biogen (4), ChEMBL-MT (25), and ExpansionRX (9). Paired comparisons use 95% bias-corrected and accelerated (BCa) bootstrap confidence intervals, which adjust for bias and skewness in the bootstrap distribution. See the paper for details of the statistical tests.
View ADMET target counts
| Model | Biogen | ChEMBL-MT | ExpansionRX | Total | Evaluated |
|---|---|---|---|---|---|
| Atom-JEPA ×10 conf. | 3 / 3 | 6 / 10 | 7 / 2 | 31 | 40 |
| Atom-JEPA | 0 / 6 | 0 / 15 | 0 / 9 | 30 | 40 |
| CKERMT | 0 / 6 | 11 / 8 | 1 / 3 | 29 | 40 |
| Chemprop | 1 / 3 | 0 / 12 | 0 / 1 | 17 | 40 |
| LightBGM + descriptors | 0 / 2 | 3 / 9 | 1 / 2 | 17 | 40 |
| KERMT*† | 1 / 1 | 3 / 9 | 0 / 1 | 15 | 38 |
| Mol-JEPA · modalities | 1 / 2 | 2 / 5 | 0 / 3 | 13 | 40 |
The target-count table covers 40 targets, whereas the ranking figure uses 38. KERMT*† reports only mean errors and omits two Biogen targets; its target-count total is based on the 38 available targets.
QM9 · MAE by target
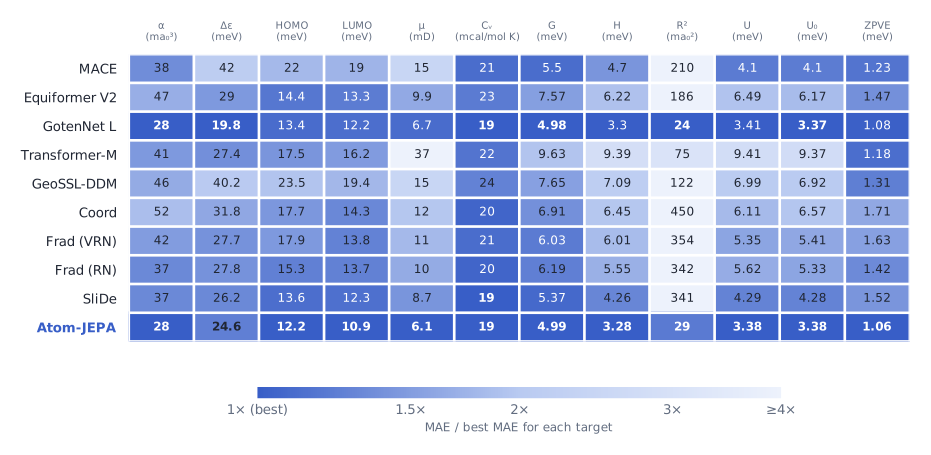
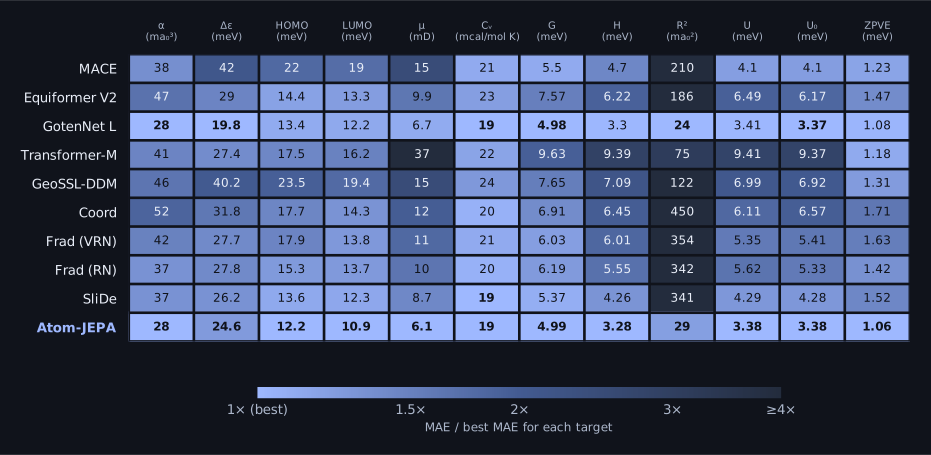
QM9. Each cell shows the reported mean absolute error (MAE; lower is better). Colour compares error with the best model for that target; the colour scale saturates at 4×. Models using a different random split are excluded from the heatmap; their values are included as grey reference rows in the detailed table below. Units: α in ma₀³; μ in mD; Cᵥ in mcal/(mol K); R² in ma₀²; all other targets in meV.
View QM9 values
| Model | α (ma₀³) | Δε (meV) | HOMO (meV) | LUMO (meV) | μ (mD) | Cᵥ (mcal/mol K) | G (meV) | H (meV) | R² (ma₀²) | U (meV) | U₀ (meV) | ZPVE (meV) |
|---|---|---|---|---|---|---|---|---|---|---|---|---|
| MACE | 38 | 42 | 22 | 19 | 15 | 21 | 5.5 | 4.7 | 210 | 4.1 | 4.1 | 1.23 |
| Equiformer V2 | 47 | 29 | 14.4 | 13.3 | 9.9 | 23 | 7.57 | 6.22 | 186 | 6.49 | 6.17 | 1.47 |
| GotenNet L | 28 | 19.8 | 13.4 | 12.2 | 6.7 | 19 | 4.98 | 3.3 | 24 | 3.41 | 3.37 | 1.08 |
| Transformer-M | 41 | 27.4 | 17.5 | 16.2 | 37 | 22 | 9.63 | 9.39 | 75 | 9.41 | 9.37 | 1.18 |
| JMP-L † | 32 | 19.1 | 8.8 | 8.6 | 8 | 17 | 4.3 | 2.8 | 163 | 2.8 | 2.9 | 0.9 |
| 3D-EMGP † | 57 | 37.1 | 21.3 | 18.2 | 20 | 26 | 9.3 | 8.7 | 92 | 8.6 | 8.6 | 1.38 |
| GeoSSL-DDM | 46 | 40.2 | 23.5 | 19.4 | 15 | 24 | 7.65 | 7.09 | 122 | 6.99 | 6.92 | 1.31 |
| Coord | 52 | 31.8 | 17.7 | 14.3 | 12 | 20 | 6.91 | 6.45 | 450 | 6.11 | 6.57 | 1.71 |
| Frad (VRN) | 42 | 27.7 | 17.9 | 13.8 | 11 | 21 | 6.03 | 6.01 | 354 | 5.35 | 5.41 | 1.63 |
| Frad (RN) | 37 | 27.8 | 15.3 | 13.7 | 10 | 20 | 6.19 | 5.55 | 342 | 5.62 | 5.33 | 1.42 |
| DenoiseVAE † | 65 | 26 | 14.2 | 11.9 | 7.9 | 15 | 5.35 | 4.19 | 62 | 4.03 | 4.31 | 1.03 |
| SliDe | 37 | 26.2 | 13.6 | 12.3 | 8.7 | 19 | 5.37 | 4.26 | 341 | 4.29 | 4.28 | 1.52 |
| TriForces † | 75 | 38.8 | 20.2 | 20.4 | 18 | 31 | — | — | — | — | 8.9 | — |
| Atom-JEPA | 28 | 24.6 | 12.2 | 10.9 | 6.1 | 19 | 4.99 | 3.28 | 29 | 3.38 | 3.38 | 1.06 |
† These models use a different random train/validation/test split from 110k/10k/11k. As in the paper, their results are shown in grey for reference only and excluded from best-result highlighting and the heatmap comparison. — denotes an unreported target.
Source: paper.
Distinct and Complementary ADMET Predictions
Atom-JEPA makes different errors from other ADMET models: compared across five model families, its test-set residuals rank as the most distinct on average under both residual correlation and uniqueness. These errors are complementary. In a five-model ensemble, Atom-JEPA is the only model whose inclusion lowers the error on all three benchmarks, with the largest reductions on ChEMBL-MT and ExpansionRX.
Atom-JEPA ranks as the most distinct on average under both measures.
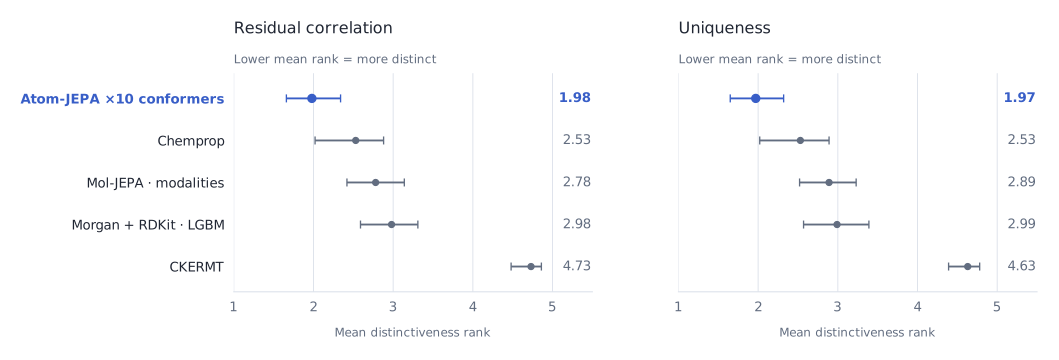
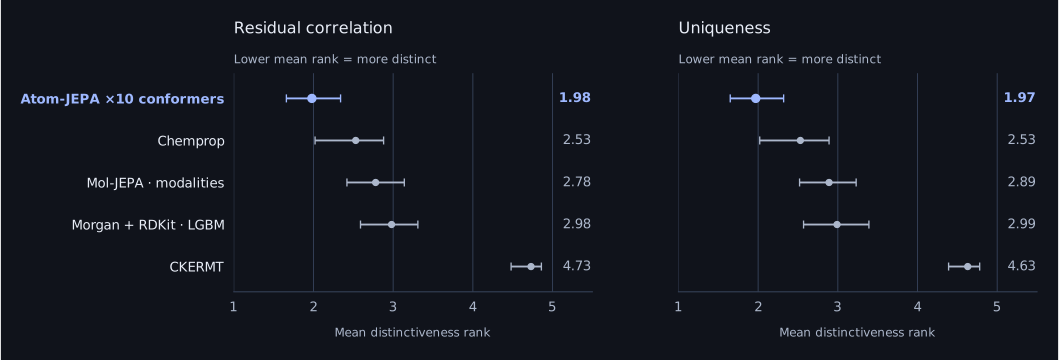
Residual correlation uses Spearman correlation to measure how similarly pairs of models make errors. Uniqueness measures how much of a model’s residual variation is unexplained by a linear combination of the other four families’ residuals (1 − adjusted R²).
Points show mean ranks with equal weight per benchmark; bars show the reported bootstrap intervals. Atom-JEPA and Chemprop are not statistically separated by the paired 95% bootstrap comparison. The ensemble improvement view measures the reduction in error from including each model.
Values and method
| Model | Biogen | ChEMBL-MT | ExpansionRX | Mean rank | Bootstrap interval | Group |
|---|---|---|---|---|---|---|
| Atom-JEPA ×10 conformers | 0.723 | 0.791 | 0.730 | 1.98 | [1.66, 2.34] | a |
| Chemprop | 0.719 | 0.803 | 0.681 | 2.53 | [2.02, 2.88] | ab |
| Mol-JEPA · modalities | 0.738 | 0.801 | 0.749 | 2.78 | [2.42, 3.14] | b |
| Morgan + RDKit · LGBM | 0.724 | 0.814 | 0.761 | 2.98 | [2.59, 3.31] | b |
| CKERMT | 0.779 | 0.829 | 0.787 | 4.73 | [4.48, 4.86] | c |
| Model | Biogen | ChEMBL-MT | ExpansionRX | Mean rank | Bootstrap interval | Group |
|---|---|---|---|---|---|---|
| Atom-JEPA ×10 conformers | 0.327 | 0.253 | 0.283 | 1.97 | [1.65, 2.32] | a |
| Chemprop | 0.325 | 0.221 | 0.392 | 2.53 | [2.02, 2.89] | ab |
| Mol-JEPA · modalities | 0.285 | 0.221 | 0.246 | 2.89 | [2.52, 3.23] | b |
| Morgan + RDKit · LGBM | 0.312 | 0.192 | 0.228 | 2.99 | [2.57, 3.39] | b |
| CKERMT | 0.214 | 0.171 | 0.187 | 4.63 | [4.39, 4.78] | c |
Analysis uses the 10-conformer Atom-JEPA model and targets with at least 30 labelled test molecules. Ranks are computed within each target and averaged with equal weight per benchmark. Intervals use a stratified cluster bootstrap over targets. Models sharing a group letter are not separated by the paired 95% bootstrap comparison of their mean ranks. See the paper for details of the statistical tests.
Source: appendix, “Model Prediction Correlation”, table “Model distinctiveness” in the paper.
Improvement from adding a model to an ensemble
Reduction in test macro MAE · higher is better
Biogen
Full ensemble 0.3261
ChEMBL-MT
Full ensemble 0.4228
ExpansionRX
Full ensemble 0.3459
Including Atom-JEPA ×10 conformers improves all three datasets, with the largest improvement on ChEMBL-MT and ExpansionRX.
Exact values and method
| Ensemble | Biogen | ChEMBL-MT | ExpansionRX |
|---|---|---|---|
| All five models | 0.3261 | 0.4228 | 0.3459 |
| Without Atom-JEPA ×10 conformers | 0.3388 | 0.4313 | 0.3646 |
| Without Chemprop | 0.3402 | 0.4248 | 0.3457 |
| Without Mol-JEPA modalities | 0.3296 | 0.4211 | 0.3426 |
| Without Morgan+RDKit LGBM | 0.3133 | 0.4221 | 0.3431 |
| Without CKERMT | 0.3237 | 0.4263 | 0.3480 |
Each model receives equal weight. Atom-JEPA conformers are averaged first, followed by replicates of each model: Biogen scaffold seed 1, all four ChEMBL fold/seed runs, and five ExpansionRX seeds. These are full-test-set results, without the earlier exposure filtering. No uncertainty intervals were supplied for this comparison.
Embedding explorer
Browse Atom-JEPA embeddings of molecules and crystals as 2D or 3D UMAP, PCA, or t-SNE maps. Colour points by properties, chemical families, scaffolds, or functional groups, compare encoder layers and degrees, and select any point to view its 3D structure.
About this projection
Atom-JEPA vs No Pretraining
Compare every encoder layer: Atom-JEPA pretraining above, random initialisation below. Click a plot to enlarge.
All encoder layers
For the selected colour field. Hides missing or unassigned labels and structures without the selected group.
Loading layer comparison…
Cite
@misc{petersen2026atomjepajointembeddingpredictivearchitecture,
      title={Atom-JEPA: Joint-Embedding Predictive Architecture for 3D Atomistic Systems},
      author={Kasper Helverskov Petersen and Rasmus Hannibal Tirsgaard and François R J Cornet and Mikkel Jordahn and Mikkel N. Schmidt},
      year={2026},
      eprint={2610.08400},
      archivePrefix={arXiv},
      primaryClass={cs.LG},
      url={https://arxiv.org/abs/2610.08400},
}
arXiv:2610.08400 · 2026